Point & Figure Moment I · Origins and charting rules
Covers the origins, historical development, and practical charting rules behind Point & Figure methodology.
P&F
Foundations
“From the general formations on the figure charts we are able to detect accumulation or distribution, and we see clearly marked, the lines of support and supply. We can also identify the marking up and marking down periods to excellent advantage by means of these charts.The most valuable feature of Figure Charts, however, is their horizontal formations,which, in many cases forecast the approximate number of points stock, or a group, or the average should move.” — Richard D. Wyckoff
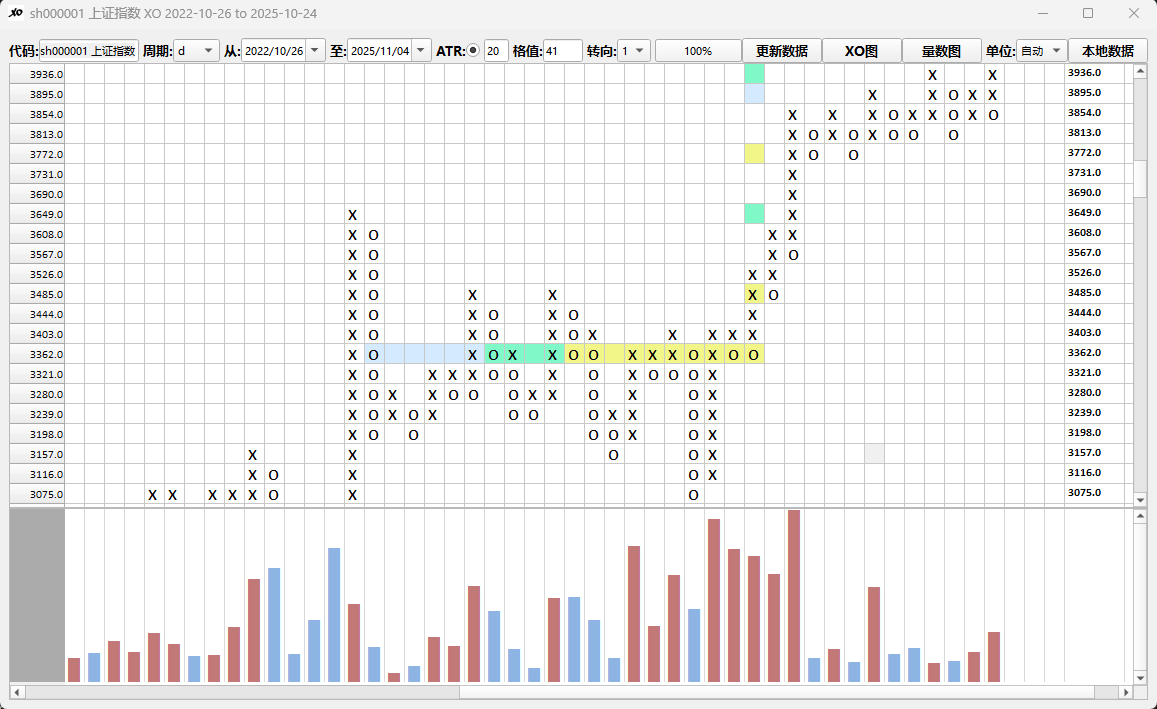
One-click access to market data for US stocks, and crypto currencies, built for Point & Figure and Volume Figure charting.


Tradeboxer focuses on second-by-second data from China’s domestic futures markets, with automatic updates and a workflow built for intraday market reading.
Articles covering Point & Figure basics, practical applications, and more advanced chart-reading topics.
Covers the origins, historical development, and practical charting rules behind Point & Figure methodology.
Focuses on XO chart analysis, measurement concepts, and the next layer of practical usage after the basics.
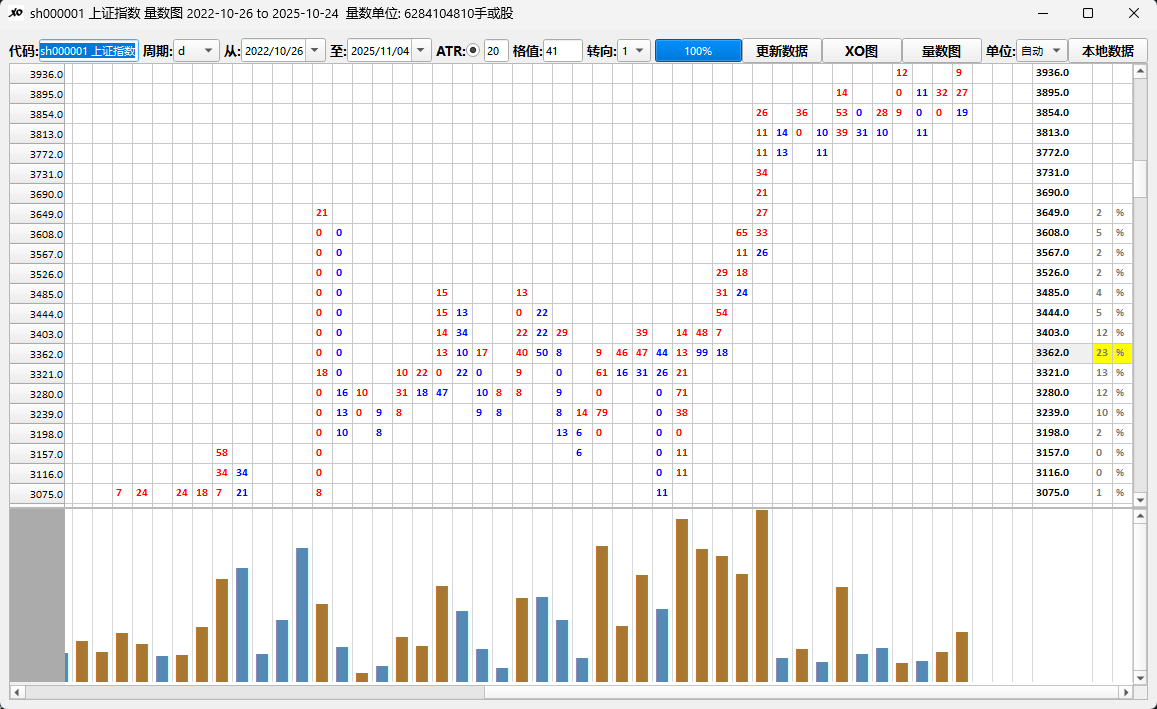
Introduces volume figure charts and discusses how they extend chart reading into a more advanced layer of interpretation.